Header Paragraph

Eruption at Sundhnúksgígar March 2024 - Chemical analyses of lava samples and volcanic gas

Image
Eruption in Sundhnukagigar February 2024 - thin section

Volcanic eruption near Sundhnúksgígar craters 17th of March – Chemical analyses of lava samples and volcanic gas

Geochemistry of the emitted lava

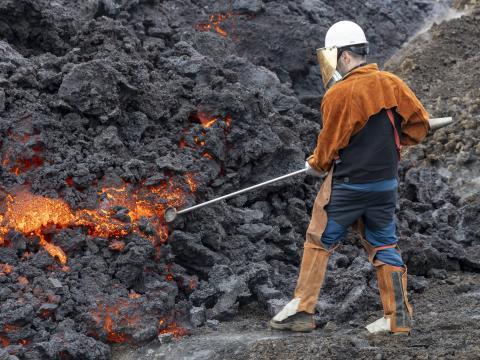
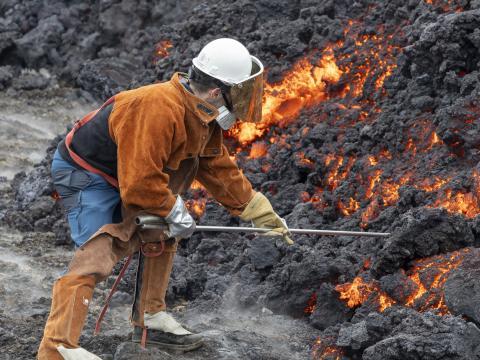
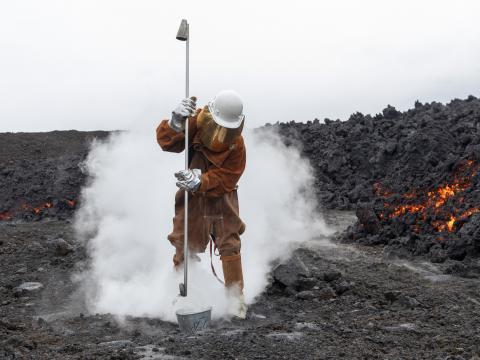
Samples of tephra were taken south of Sýlingarfell and lava from the southernmost lava front near Húsafell on the 17th of March. The first petrology and geochemical data were acquired the same day. As before, images were taken and glass analyses were carried out by the electron microprobe of the Institute of Earth Sciences, University of Iceland.

Petrologically the new lava is similar to earlier lavas from near Sundhnúksgígar craters (Fig. 1). The chemical composition of the lava is also similar to the earlier lavas. For instance, the MgO content of the glass in the groundmass of the lava is 6.0 wt% whereas it is 6.8 wt% in the groundmass of the tephra. The average K2O/TiO2 ratio in the lava and tephra glass is 0.21 which points to relationship with magmas in earlier eruptions near Sunhnúksgígar craters. For more information we refer to previous reports at the website of the Institute of Earth Sciences.

Composition of volcanic gas

Measurements of the volcanic gas composition using open-path Fourier Transform Infrared Spectroscopy (OP-FTIR) were performed in the early hours of 17th of March. These measurements are done in cooperation of scientists from the University of Iceland and the Icelandic Meteorological Office (IMO). The measured gas composition is similar to what was measured on the 14th and 15th of January and 8th of February, with CO2/SO2 mass ratios of approximately 0.8.

SO2 emissions during the Sundhnúkur eruptions – Comparison with the Fagradalsfjall events

Sulphur (S) is a minor element in basaltic magmas, but when it is released, it causes significant hazard as the emitted SO2 is a poisonous gas.

S contents in basaltic glass is routinely analyzed by the electron microprobe at the Institute of Earth Sciences, University of Iceland. We measure the S content of glassy melt inclusions (Fig.1a) and groundmass glass in quenched lava (Fig.1a) and tephra (Fig.1b) samples to better characterize SO2 emissions during and after eruptions.

Glassy melt inclusions are trapped in minerals during mineral growth in the magma reservoir before the onset of SO2 release. In contrast, groundmass glass in tephra and basaltic glass quenched in the field are at least partially or fully degassed, which means lower S content compared to melt inclusions. Fig. 1 a and b shows an example of the difference in S content between melt inclusions and different types of groundmass glasses (quenched lava and tephra) in ppm S. The melt inclusion contains 1500 ppm S, whereas the groundmass glass in the quenched lava contains only 230 ppm S. The difference, 1270 ppm S, was released to the atmosphere before quenching.

Image
Thin sections for lava and tephra samples_20240317

Figure 1: Backscattered electron images of (a) quenched lava (sampled during the 2024 January event) and (b) highly vesicular tephra (sampled on the 17th of March 2024). The quenched lava (a) contains olivine microphenocrysts with glassy melt inclusions. Numbers in orange are S contents in ppm. Note, that the highly vesicular tephra (b) contains a somewhat higher amount of S compared to the quenched lava (a).

Figure 2 shows S contents of melt inclusions and groundmass glasses analyzed during the 2023-24 Sundhnúkur and 2021-2023 Fagradalsfjall events (Halldórsson et al., 2021, Caracciolo et al. in review, Guðmundsdóttir, unpublished). Although there is some variability in the S contents in melt inclusions from the 2023-24 Sundhnúkur events, these melt inclusions contain on average 400 ppm more S than those from Fagradalsfjall. Thus, the lava emitted on the surface during the 2023-24 Sundhnúkur events have a higher S release potential than the lava emitted during the Fagradalsfjall events.

Based on the difference between melt inclusion and groundmass glass compositions and the density of the emitted basalt, we calculate that 1 m3 vesicle-free basalt emitted ~5.5 kg SO2 during the Fagradalsfjall eruptions, while this value is ~7.4 kg during the Sundhnúkur events. When magma emission rates are available, these values help to calculate the amount of emitted SO2 during different phases of the eruptions and we can compare these to the results of field measurements.

The difference of S content between the tephra glass (quenched in the air during the eruption) and the lava glass (quenched in the field in a bucket of water) shows that most SO2 is emitted at the vent, but SO2 emission is still significant along the lava flow.

As pointed out previously, volcanic gas in the last eruptions near Sundhnúksgígar craters has lower CO2/SO2 mass ratio (~0.8) than was measured in volcanic gas at the beginning of the Fagradalsfjall eruptions (~5.0). This indicates that magma near Sundhnúksgígar has partly degassed in the upper part of the crust before eruptions.

Image
Comparison of S content between Fagradalsfjall and Sunhnúkur events

Figure 2: Comparison of melt inclusion and groundmass glass S contents during the Fagradalsfjall and Sundhnúkur events. Red X indicates the averages of the 5-10 least degassed melt inclusions analyzed during each event, arrows show the 1 standard deviation. Green X indicates the average S content of groundmass glasses with 1 standard deviation.


References:

Caracciolo et al. (under review): https://eartharxiv.org/repository/view/6291/

Halldórsson et al. (2022): https://www.nature.com/articles/s41586-022-04981-x